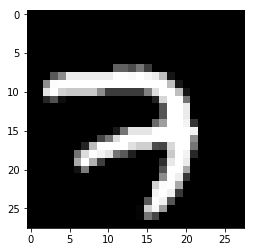
I find default visualization settings for images in matplotlib inconvenient. Usually I prefer to see images in grayscale color map and without smoothing. Thus I see actual data without distortions. Grayscale is easier to understand.
| |
Compare default colors and interpolation:
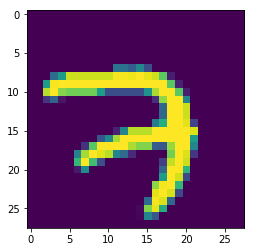
and after applying the settings: